What's New
|
Published on Monday, 10 October 2016
|
||||||||||||||||||||||||||||||
|
Published on Monday, 10 October 2016
|
||||||||||||||||||||||||||||||
|
Published on Tuesday, 20 September 2016
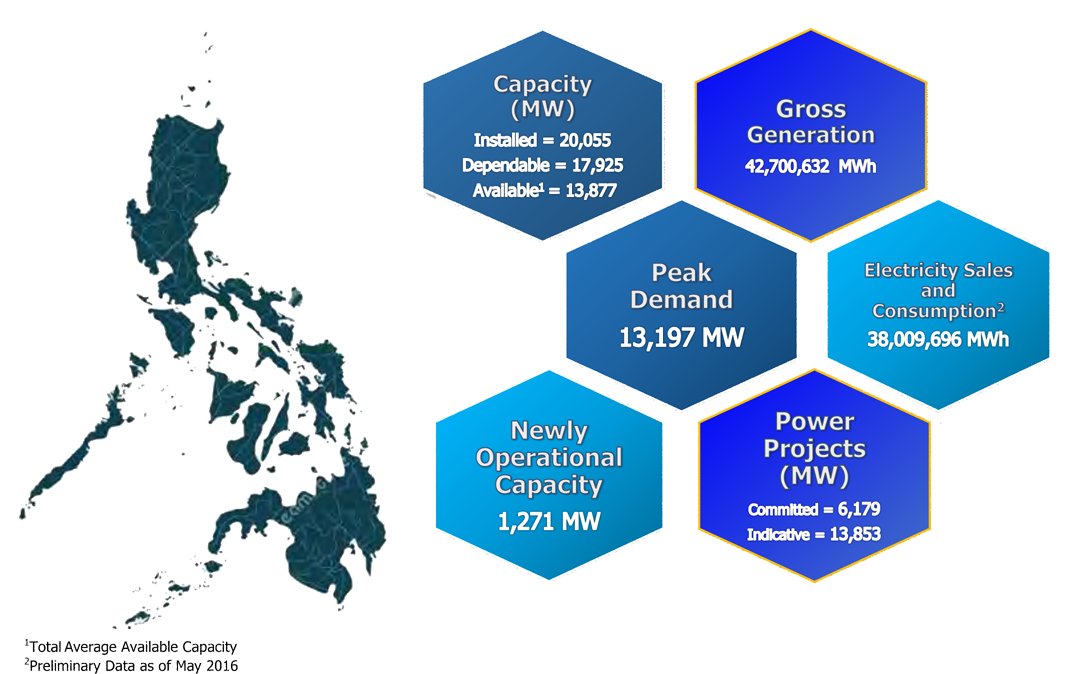
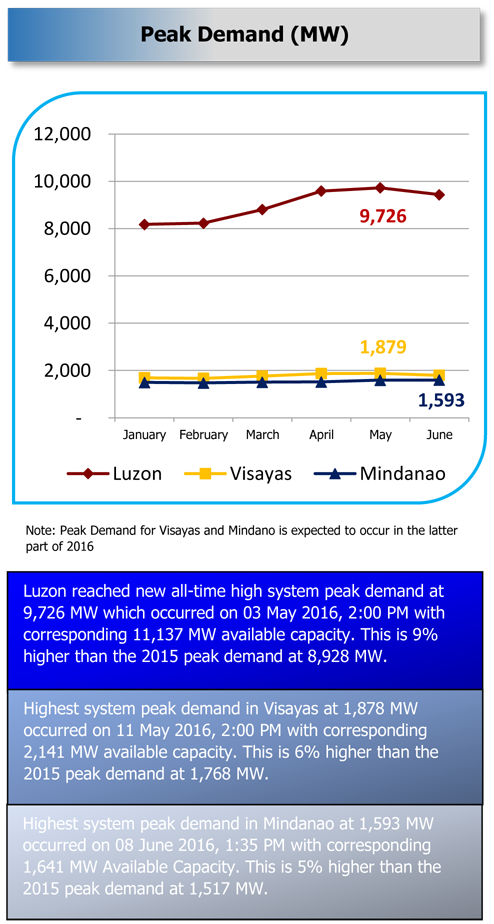
Philippine Power Demand-Supply Situation remained stable in the First Quarter of 2016 despite the onset of strong El Niño which generally resulted in increased peak demand levels in the three Grids. On the supply side, hydro capacities especially in Mindanao decreased. Several yellow and red alerts were declared by the system operator in Luzon and Visayas during the summer period of April to May 2016. However, the Energy Sector’s El Niño Mitigation Measures alongside with the preparation for the 09 May 2016 National and Local Elections stabilized the power situation during the critical periods. These measures include the activation of the Interruptible Load Program (ILP), ensuring minimal forced outages, management of power plant maintenance schedules and optimization of hydro capacities specifically in Mindanao. Note: Due to rounding totals may not correspond to the sum of all figures Definition of Terms Installed Capacity
Dependable Capacity
Available Capacity
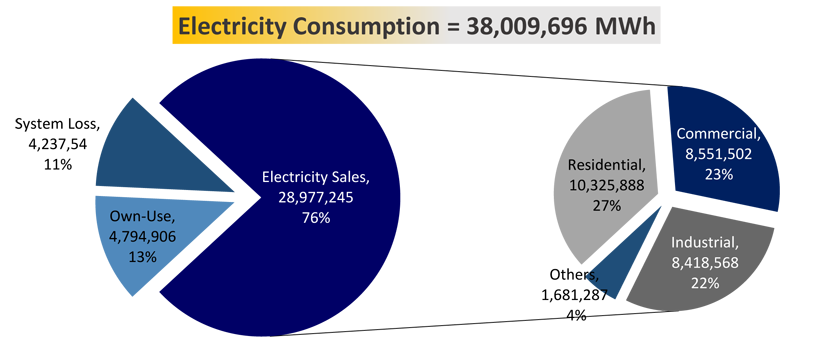
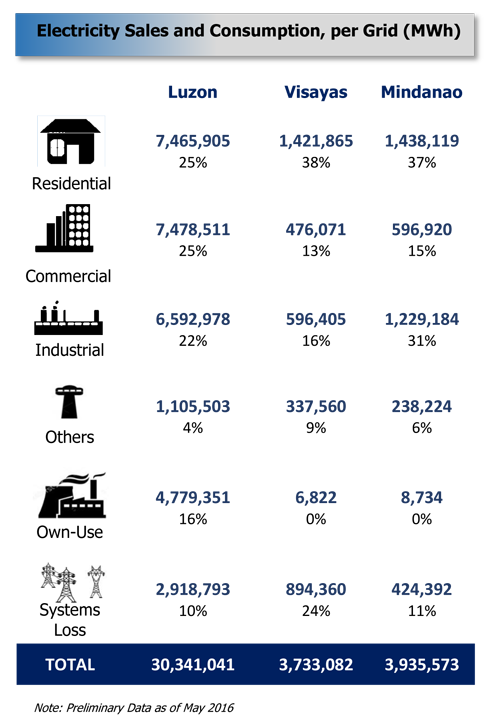
Gross Generation - total generation of electricity by an electrical power plant Peak Demand - maximum electrical demand occurring at any given period of time Electricity Sales - actual energy sold by Distribution Utilities (DUs) to the residential, commercial, industrial and others sectors Electricity Consumption - electricity sales plus the own-use consumption of power plant and systems loss Committed Power Projects - private sector initiated power projects which have already secured financial closing Indicative Power Projects - private sector initiated projects which have already applied for DOE Endorsement for the conduct of the System Impact Study (SIS) and yet to secure financial closing Interruptible Load Program – a demand-side management program which allows big end-users to disconnect from the grid, use their own generators, and get an ERC-approved compensation January - June 2016 Philippine Power Demand
Click link to view/download PDF File of 2016 Power Situation Highlights |
||||||||||||||||||||||||||||||
|
Published on Tuesday, 20 September 2016
January-December 2015 Summary
SIGNIFICANT INCIDENTS
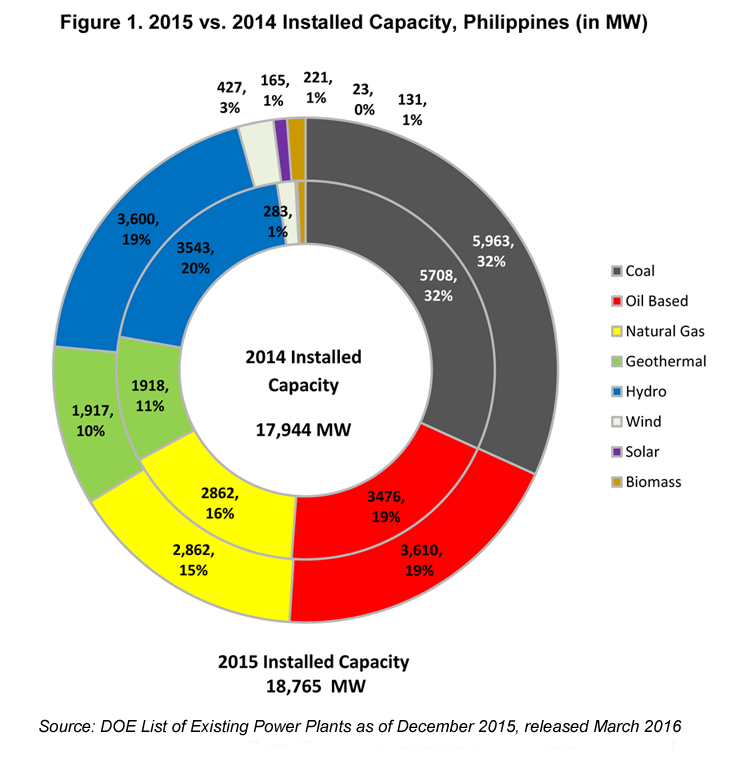
A. INSTALLED, DEPENDABLE AND AVAILABLE CAPACITY The Philippines’ total installed generating capacity continued to grow by 4.6% from 17,944 MW in 2014 to 18,765 MW in 2015 equivalent to 821 MW increase. Coal-fired power plants constitute the largest share in the installed and dependable capacity in 2015 at 32% and 34% respectively. Among renewable energy, hydro sources’ share remained the highest at 19% majority of which comes from the Mindanao Grid. With the FIT incentives and continued support of the DOE and energy agencies and stakeholders, Variable Renewable Energy (VRE) such as wind and solar grew remarkably by 50.9% (144 MW increase) and 616.0% (142 MW increase) respectively from 2014 to 2015 as shown in Figure 1.
The percent share on a per Grid basis remained unchanged over the years. In 2015, almost 75% of the total capacities was in... Read more |
||||||||||||||||||||||||||||||
|
Published on Friday, 16 September 2016
|

