2022 Power Situation ReportMonday, 2 December 2024
Peak Demand In 2022, the Philippines' total non-coincidental peak demand1 reached 16,596 MW, which is 560 MW or 3.5% higher than the peak demand in 2021. Taking off from the height of the pandemic in 2020, this increase in demand is attributed to the ease of Government restrictions in the whole country and the gradual return to normalcy of economic activities that allows the recovery of the economy. The lifting of COVID-19 pandemic restrictions paved the way for the recovery of different businesses and services in the country. This recovery also required a higher demand for electricity which caused the gradual increase of the total energy consumption in the country in the previous two years. Additionally, the travel restrictions set by different Local Government Units were relaxed resulting in demand growth in 2021 and 2022. Figure 1 shows the comparison between the recorded peak demand in 2022 and 2021 for the Luzon, Visayas, and Mindanao grids. Among these three, Luzon had the highest increase in peak demand of 537 MW in 2021 and 473 MW in 2022 as Metro Manila, the country's center for economic activity, recovered from the effects of pandemic. 1 Total non-coincidental peak demand of Luzon, Visayas and Mindanao grids
Click to view/download PDF file of 2022 Power Situation Report
|
||||||||||||||||||||||||||||||||||||||||||||||||||||||||||||||||||||||||||||||||||||||||||||||||||||||||||||||||||||||||||||||||||
2020 Power Situation ReportMonday, 23 August 2021
Peak Demand In 2020, the Philippines' total non-coincidental peak demand1 reached 15,282 MW, which is 299 MW or -1.9% lower than the peak demand in 2019. This decline in demand can be greatly attributed to the effect of COVID-19 pandemic, which put the country under different levels of community quarantine beginning 15 March 2020. The declaration of community quarantine caused huge economic losses in a number of businesses and commercial establishments, resulting in an evident slowdown in the operations of the commercial and industrial sectors. Additionally, the travel restrictions put in place by the Philippine Government across the entire country limited the movement of the people which further hindered the otherwise expected demand growth. 1 Total non-coincidental peak demand of Luzon, Visayas and Mindanao grids
Click to view/download PDF file of 2020 Power Situation Report |
||||||||||||||||||||||||||||||||||||||||||||||||||||||||||||||||||||||||||||||||||||||||||||||||||||||||||||||||||||||||||||||||||
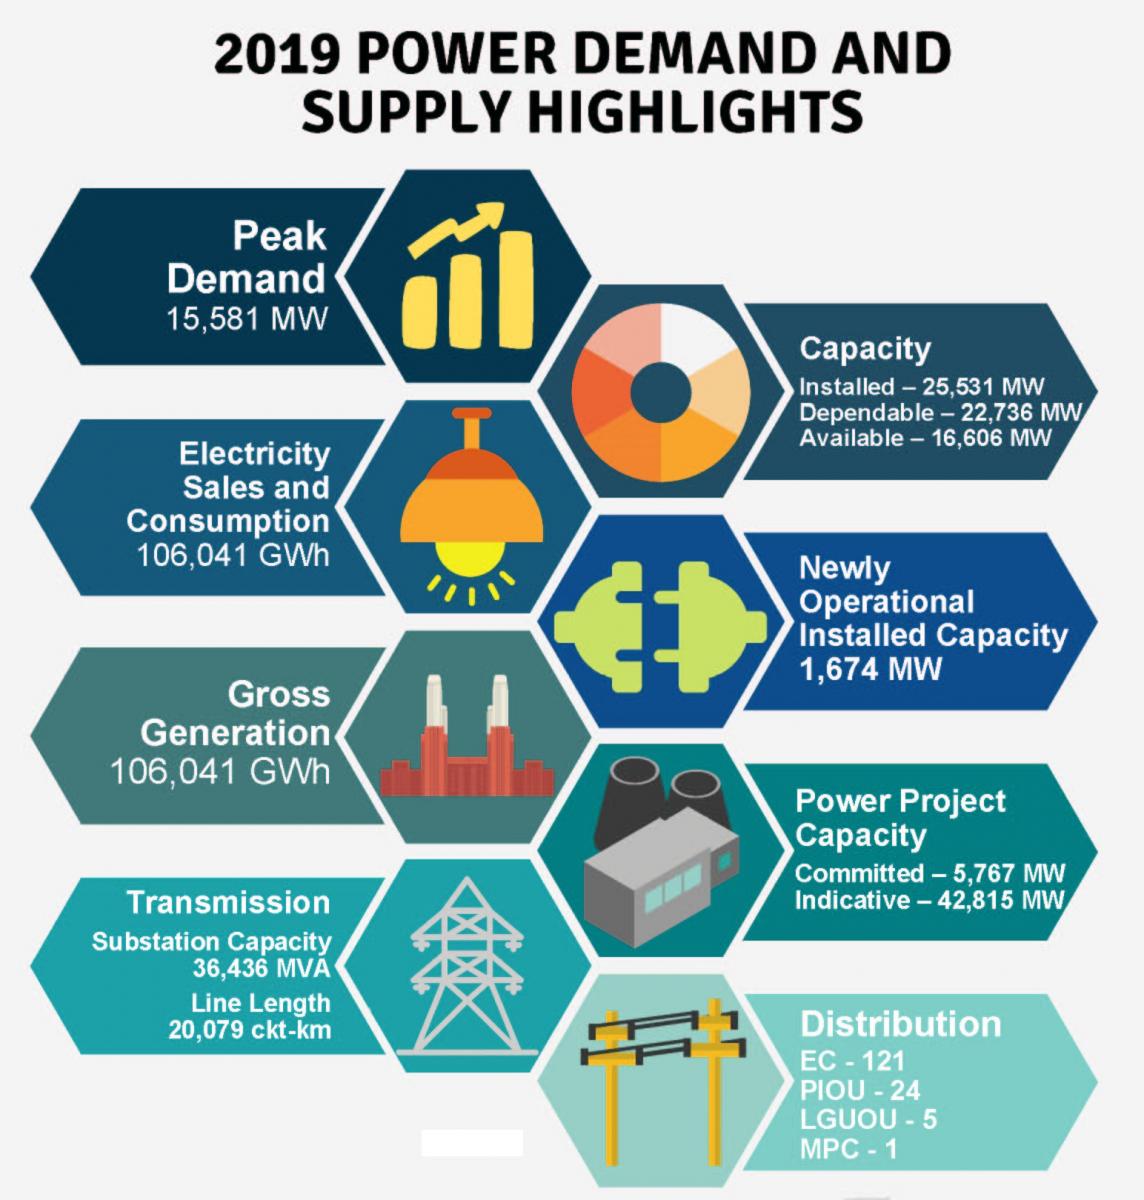
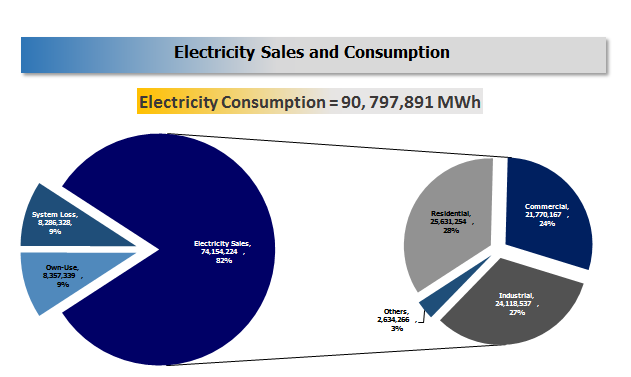
2019 Power Situation ReportFriday, 24 July 2020The country’s total peak demand1 in 2019 was recorded at 15,581 MW, which is 799 MW or 5.4% higher than the 14,782 MW in 2018. As recorded by the System Operator, the Luzon grid contributed 11,344 MW or 72.8% of the total demand while Visayas and Mindanao contributed a share of 14.3% (2,224 MW) and 12.9% (2,013 MW), respectively. With reference to year 2018, the peak demand of Luzon increased by 468 MW or 4.3% while Visayas and Mindanao grew by 8.3% and 8.6%, respectively. The Philippines’ Gross Domestic Product (GDP) posted a 5.9% full-year growth for 2019, 0.3% below the previous year’s GDP, the slowest growth rate in eight years. In the 4th quarter of 2019, the GDP grew by 6.4%, but it was still not enough to meet the target economic growth which ranges from 6.0% to 6.5%. Nonetheless, historical data has shown that when the Philippines experienced an expanding economy or a positive GDP growth rate, that expansion was directly proportional to electricity consumption. Therefore, correlating the relationship between the two, a continuous GDP growth entailed a consistently rising demand in electricity. The total electricity sales and consumption grew by 6.3%, with an absolute level of 106,041 GWh by the end of 2019 from 99,765 GWh of the previous year. As the rate of inflation slowed down to an average of 2.5% in 2019 from a noticeably higher rate of 5.2% in 2018, the country as expected experienced a boost in electricity consumption. The sector with the largest consumption remains to be residential (28.8%) followed by industrial (26.6%) and commercial (24.0%). The industrial sector is the only sector whose annual growth rate took a downswing from its rapid increase of 7.9% in 2018 down to only 2.2% in 2019. One factor of the decline can be attributed to the slowdown in public construction at the start of 2019 as a result of the delayed approval of the Administration’s 2019 budget and the 45-day public works ban due to the 2019 National and Local Elections on 13 May 2019. Likewise, the reduction in public infrastructure spending, hence lagging in construction-related manufactures, and the weaker global economy resulted in a decrease in both volume and value of the manufacturing sector, only improving in the latter part of the year bolstered by the surge in public spending of 54% or ₱100.3 billion in September as state agencies expedited the implementation of major infrastructure projects as part of their catch-up measures. As a result, electricity sales and consumption of the industrial sector went up by 3.8% for the second half of the year. On the other hand, the growth rate of the residential and commercial sectors remained persistent as the consumption increased by 8.1% and 6.1%, respectively, against last year’s growth rate of 5.5% for both sectors due to election-related activities and warmer temperature in the summer months. The continuous rise in global surface temperatures primarily contributed to the uptrend as heat indices hit dangerous levels especially in the months of April, May, and June. Moreover, the El Niño event throughout the year is a likely driver of the variation in consumption especially in households and commercial spaces e.g. an increase in consumption can be attributed to substantial utilization of cooling equipment. “Others”, referring to public buildings, street lights, irrigation, agriculture, and “others not elsewhere classified”, continued to post a modest growth rate of 5.2% from 2,753 GWh in 2018 to 2,897 GWh in 2019. Parallel to the Others sector, the utilities’ own-use for office and station use of the power plants, classified in Fig. 2 simply as “Own-Use”, grew significantly by 9.7% or 8,929 GWh from a previous diminution of 2.1% between 2018 and 2017. While this year, “Losses” from the generation, transmission, and distribution accounted for 9,994 GWh, the largest growth by sector with a 988 GWh or 11.0% increase from 2018 due to the testing and commissioning of various power plants in the country with total capacities of 2,002 MW (Luzon - 1,035 MW, Visayas - 371 MW and Mindanao - 596 MW). 1 Total non-coincidental peak demand of Luzon, Visayas and Mindanao grids
Click to view/download PDF file of 2019 Power Situation Report |
||||||||||||||||||||||||||||||||||||||||||||||||||||||||||||||||||||||||||||||||||||||||||||||||||||||||||||||||||||||||||||||||||
2018 Power Supply and Demand HighlightsThursday, 6 June 2019
In spite of the slowdown in the growth of the Philippine economy in 2018 to 6.2% compared to 6.7% in 2017 and below the government’s downward revised target which ranges from 6.5% to 6.9% for 2018, the total electricity sales and consumption all over the country still posted a notable figure of 99,765 GWh in 2018 from 94,370 GWh in 2017, equivalent to 5.7% growth from the previous year. Out of these total sales and consumption, 56,036 GWh or 56.2% was contributed by Private Investor Owned Utilities (PIOU’s), while 21,486 GWh or 21.5% was from the Electric Cooperatives’ contributions. Non-utilities and Other Services were 4,318 GWh (4.33%) and 2,203 GWh (2.21%), respectively. Total sales accounted to 84,043 GWh, corresponding to 84.2% share to total consumption. |
||||||||||||||||||||||||||||||||||||||||||||||||||||||||||||||||||||||||||||||||||||||||||||||||||||||||||||||||||||||||||||||||||
2017 Power Supply and Demand Highlights (January-December 2017)Tuesday, 17 July 2018
The country’s total peak demand in 2017 was recorded at 13,789 MW, which is 517 MW or 3.9% higher than the 13, 272 MW in 2016. On the other hand, the total power supply, in terms of installed capacity, grew by 6.1% from 21,425 MW in 2016 to 22,730 MW in 2017. A total of 835 MW new capacities were added to the country’s supply base in 2017 which include coal-fired (630 MW), solar (127 MW), oil-based (77 MW), and hydropower (1 MW). In terms of share by grid, Luzon contributed 392 MW or 47%, Mindanao at 337 MW or 40% and Visayas at 106 MW or 3%. The year also saw the end of the constrained demand in Mindanao which grew by 6.5% or 107 MW from 1,653 MW in 2016 to 1,760 MW in 2017. Philippine Power System continued to exhibit its resiliency and stakeholders’ unified actions in the onslaught of challenges in 2017. Natural and man-made disasters hit some parts of the country, coupled with the continued concerns on forced outages of large power generation plants, as well as the transmission and distribution system. The most notable of these is the 6.5 magnitude earthquake in the Visayas (Jaro, Leyte) which occurred in the second half of 2017, damaging geothermal power generation, transmission and distribution facilities, and resulted to the total loss of power in the provinces of Samar, Leyte, and Bohol. In Mindanao, the Marawi Siege led to the multiple partial blackout in the franchise area of the Lanao Del Sur Electric Cooperative (LASURECO) and total blackout in Marawi City. In view of these incidents, the DOE initiatives to integrate in its plans, policies, and programs the energy resiliency, performance assessment of the power industry participants to improve energy security and reliability were very timely. The DOE published power-related development plans (Power Development Plan 2016-2040; Distribution Development Plan 2016-2025; and Missionary Electrification Development Plan 2016-2020) which laid down the basic data and information of the Philippine Power System; power supply and demand outlook in grid and off-grid areas; and power sector roadmaps, policies, and programs for the short-, medium- and long-term horizon. These serve as investors’ references in business development in the country. Click to view/download PDF file of Power Supply and Demand Highlights |
||||||||||||||||||||||||||||||||||||||||||||||||||||||||||||||||||||||||||||||||||||||||||||||||||||||||||||||||||||||||||||||||||
Power Supply and Demand Highlights (January-June 2017)Tuesday, 24 October 2017
The Philippine Power System remained generally stable from January to June 2017 despite the natural and man-made calamities experienced during the period such as earthquakes in Batangas in Luzon and Leyte in Visayas and the Marawi siege in Mindanao; and events such as Malampaya Gas maintenance shutdown in Luzon, continued occurrences of forced outages of generation and transmission facilities which resulted to load dropping incidents in the three major grids. The strong coordination among all energy stakeholders to immediately respond to these challenges was key towards this end, coupled with the additional power generation capacities of 237 MW. The relatively low demand during critical supply periods also aid in maintaining the stability of the power system. To ensure the delivery of quality, reliable, affordable, and secured electricity supply, the DOE initiated the issuance of policies for resiliency, conduct of performance assessment and technical audit for all energy facilities, and reactivated the Inter-Agency Task Force on Securing Energy Facilities (IATFSEF), among others. Click to view/download PDF file of Power Supply and Demand Highlights |
||||||||||||||||||||||||||||||||||||||||||||||||||||||||||||||||||||||||||||||||||||||||||||||||||||||||||||||||||||||||||||||||||
2016 Philippine Power Situation ReportSunday, 23 July 20172016 Philippine Electricity Demand-Supply Snapshot
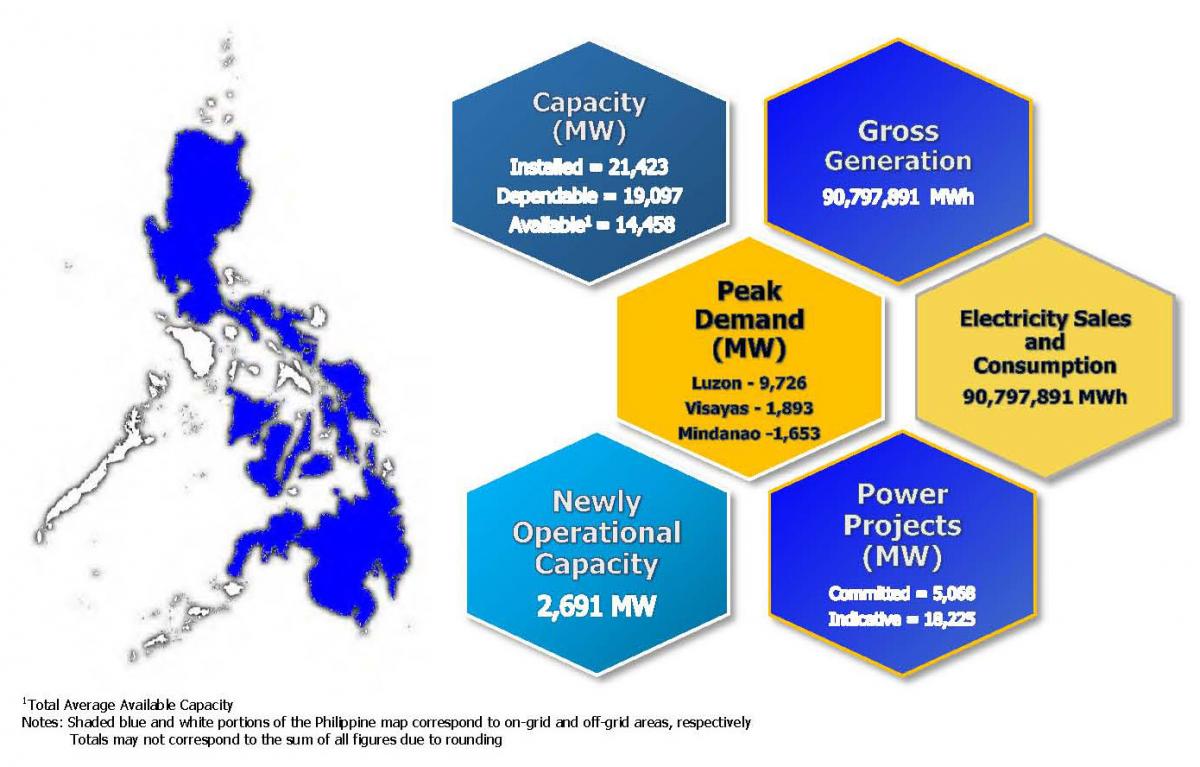
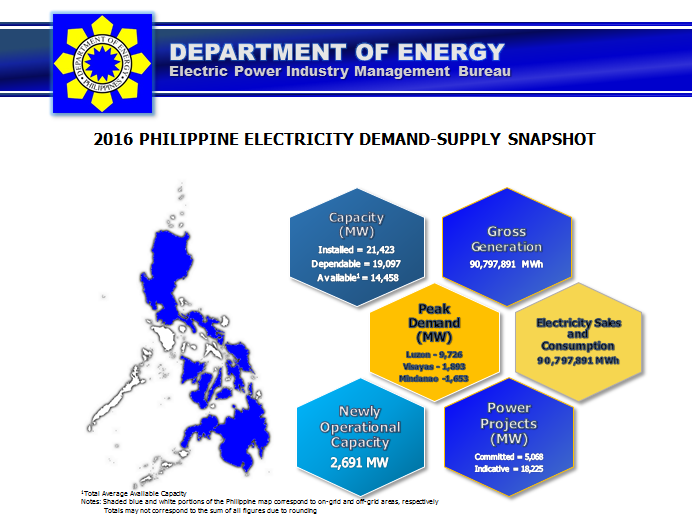
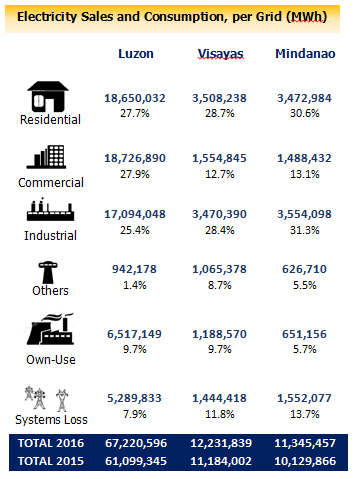
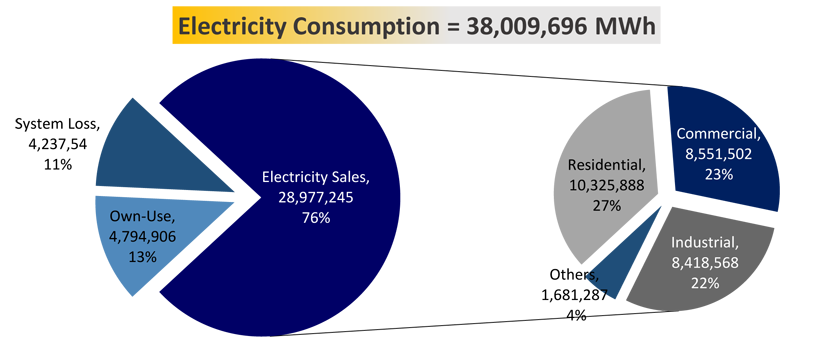
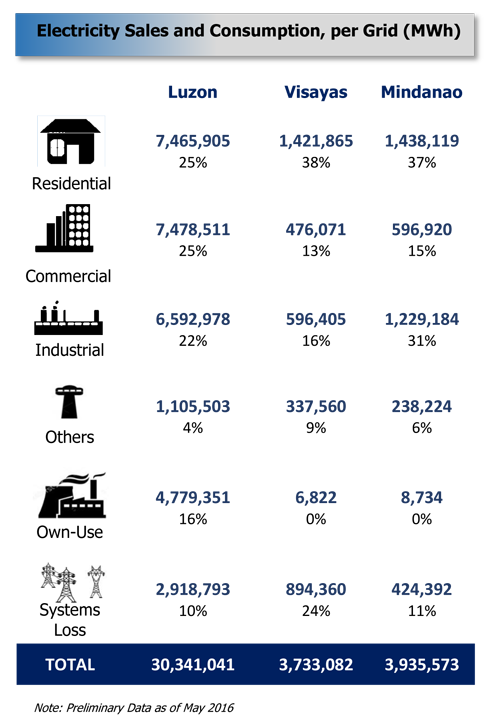
The year 2016 is characterized by a significant increase in electricity consumption at 10% and peak demand at 8.7% attributed to several factors such as the increase in temperature and utilization of cooling equipment aggravated by the strong El Niño, the conduct of National and Local elections during the first half of the year, increase in economic growth, and entry of large power generating plants. The residential and industrial sectors remained the major drivers of electricity consumption in the country while Luzon remained the largest on a per grid basis. Notably, the growth of the country’s supply base supplemented the increase in demand with the growth of total installed capacity at 14% from 18,765 MWh (2015) to 21,423 MWh (2016) majority coming from coal-fired power plants. Among the three grids, Mindanao has the highest recorded growth in terms of capacity at 31% from 2015-2016. From 2017-2025 a total of 5,068 MW committed projects are expected to come online. The DOE is continuously encouraging investments in power generation in view of the increasing peak demand which is expected to grow by more than triple* in 2040. Along with supply security, the DOE also embarks on increasing the reliability and resiliency of the system. In 2016, several yellow and red alerts were declared by the system operator in Luzon and Visayas in addition to the major grid disturbances and load dropping incidents. Among the three major grids, Mindanao was adversely affected by El Niño which caused the decline in hydro power generation and curtailment of supply during the first half of 2016. The entry of large coal-fired power plants in Mindanao on the latter part of 2016 has addressed these supply shortfalls. Click to view/download PDF file of 2016 Philippine Power Situation Report |
||||||||||||||||||||||||||||||||||||||||||||||||||||||||||||||||||||||||||||||||||||||||||||||||||||||||||||||||||||||||||||||||||
2016 Philippine Power Situation ReportWednesday, 7 June 2017
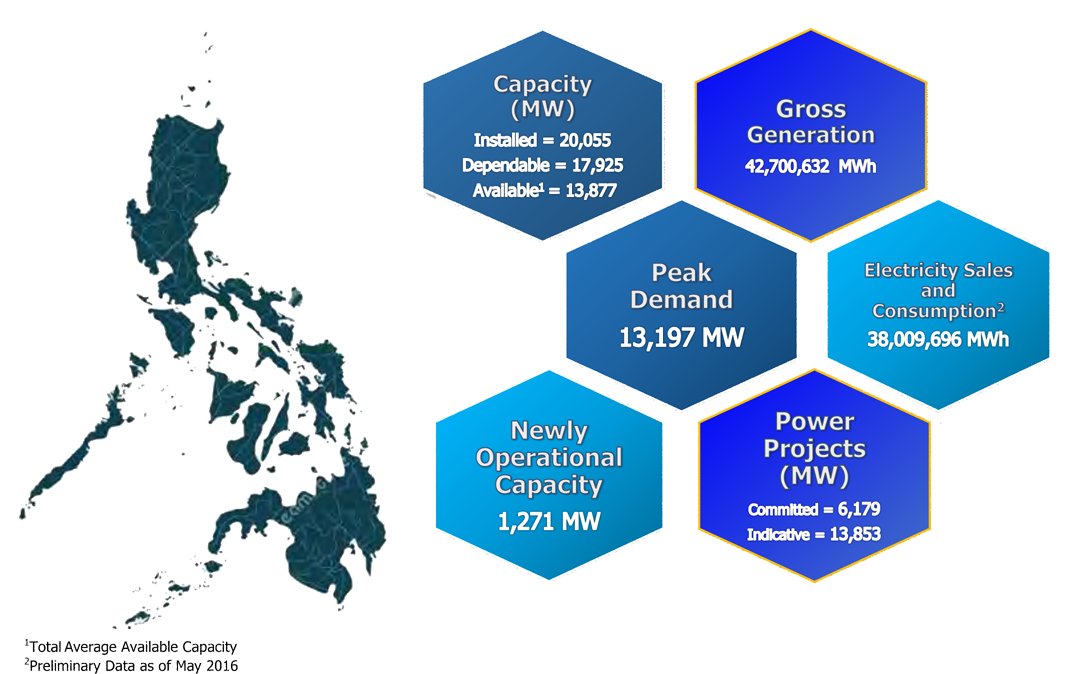
The year 2016 is characterized by a significant increase in electricity consumption at 10% and peak demand at 8.7% attributed to several factors such as the increase in temperature and utilization of cooling equipment aggravated by the strong El Niño, the conduct of National and Local elections during the first half of the year, increase in economic growth, and entry of large power generating plants. The residential and industrial sectors remained the major drivers of electricity consumption in the country while Luzon remained the largest on a per grid basis. Notably, the growth of the country’s supply base supplemented the increase in demand with the growth of total installed capacity at 14% from 18,765 MWh (2015) to 21,423 MWh (2016) majority coming from coal-fired power plants. Among the three grids, Mindanao has the highest recorded growth in terms of capacity at 31% from 2015-2016. From 2017-2025 a total of 5,068 MW committed projects are expected to come online. The DOE is continuously encouraging investments in power generation in view of the increasing peak demand which is expected to grow by more than triple* in 2040. Along with supply security, the DOE also embarks on increasing the reliability and resiliency of the system. In 2016, several yellow and red alerts were declared by the system operator in Luzon and Visayas in addition to the major grid disturbances and load dropping incidents. Among the three major grids, Mindanao was adversely affected by El Niño which caused the decline in hydro power generation and curtailment of supply during the first half of 2016. The entry of large coal-fired power plants in Mindanao on the latter part of 2016 has addressed these supply shortfalls.
Electricity Sales and Consumption Highlights
Comparative Peak Demand, Actual 2015-2016 vs. Forecast
* Actual 2016 Peak Demand was already adopted in the PDP, 2016-2040 since the peak demand already occurred prior to the finalization of the PDP, 2016-2040
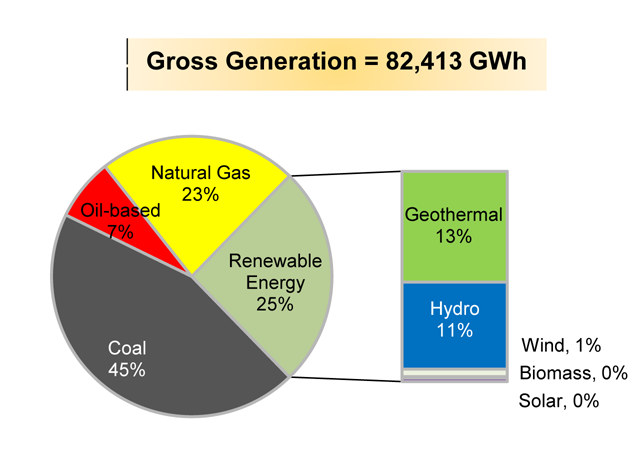
The country’s total installed capacity for 2016 grew to 21,423 MW compared to 18,765 MW from 2015. This increase in capacity is associated with the commercial operation of new power plants in Luzon such as the 2x150 MW SLPGC Coal Power Plant, 450 MW San Gabriel Natural Gas Power Plant; Visayas the 135 MW Palm Concepcion Coal Power Plant Unit 1, 132.5 MW HELIOS Solar Farm; and Mindanao the 2 x 135 MW FDC Misamis Coal Power Plant, and 150 MW SMC Malita Coal Power Plant. On the other hand, the country has a total of 19,097 MW dependable capacity or about 89% of the total installed capacity which has been delivered to the grid. The Philippines also displayed a significant growth in power generation at 10% from 82,413,213 MW in 2015 to 90,797,891 MW in 2016. Of this total generation, 48% comes from coal, 22% comes from natural gas and 6% comes from oil-based generation. The remaining 24% or about one-fourth of the total power generation comes from renewable energy (RE) – based generating facilities.
Read more on 2016 Philippine Power Situation ANNEXESAnnex 1. Luzon Actual 2016 Electricity Demand-Supply Situation Annex 2. Visayas Actual 2016 Electricity Demand-Supply Situation Annex 3. Mindanao Actual 2016 Electricity Demand-Supply Situation Annex 4. 2016 List of Existing Power Plants, Philippines Annex 5. 2016 List of Existing Power Plants, Luzon Annex 6. 2016 List of Existing Power Plants, Visayas Annex 7. 2016 List of Existing Power Plants, Mindanao Annex 8. Luzon Grid Committed Power Projects As of 31 December 2016 Annex 9. Luzon Grid Indicative Power Projects As of 31 December 2016 Annex 10. Visayas Grid Committed Power Projects As of 31 December 2016 Annex 11. Visayas Grid Indicative Power Projects As of 31 December 2016 Annex 12. Mindanao Grid Committed Power Projects As of 31 December 2016 Annex 13. Mindanao Grid Indicative Power Projects As of 31 December 2016 Annex 14. Electricity Sales and Consumption by Sector, 2003-2016 (in GWh). Annex 15. Electricity Sales and Consumption by Sector, per Grid, 2003-2016 (in GWh). Annex 16. Annual System Peak Demand per Grid, 1985-2016 (in MW). Annex 17. Visayas Annual System Peak Demand per Sub-Grid, 1995-2016 (in MW) Annex 18. Luzon Monthly System Peak Demand, 2001-2016 (in MW) Annex 19. Visayas Monthly System Peak Demand, 2001-2016 (in MW) Annex 20. Mindanao Monthly System Peak Demand, 2001-2016 (in MW) Annex 21. Philippine Gross Generation by Plant Type, 2003-2016 (in GWh) Annex 22. Luzon, Visayas and Mindanao Gross Generation by Plant Type, 2003-2016 (in GWh) Annex 23. Visayas Subgrid Gross Generation by Plant Type, 2003-2016 (in GWh) Annex 24. Gross Power Generation by Ownership, 2003-2016 (in GWh)
|
||||||||||||||||||||||||||||||||||||||||||||||||||||||||||||||||||||||||||||||||||||||||||||||||||||||||||||||||||||||||||||||||||
January-June 2016 Power Situation HighlightsTuesday, 20 September 2016
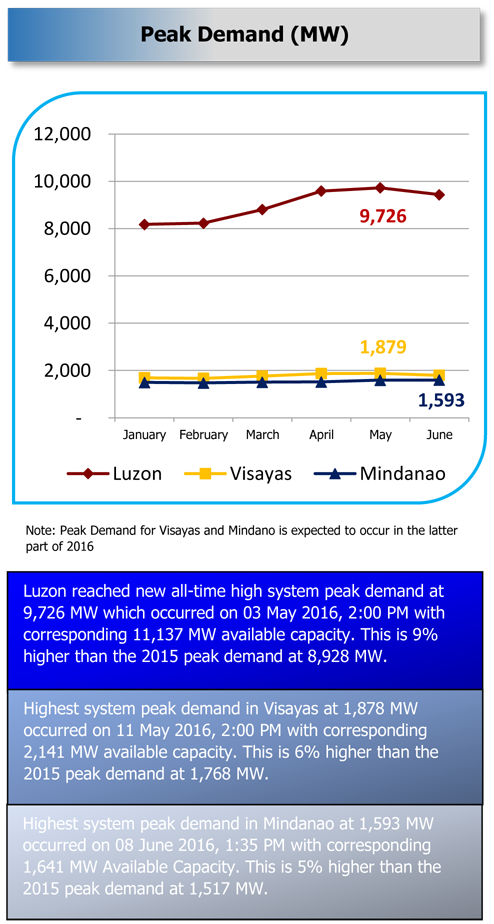
Philippine Power Demand-Supply Situation remained stable in the First Quarter of 2016 despite the onset of strong El Niño which generally resulted in increased peak demand levels in the three Grids. On the supply side, hydro capacities especially in Mindanao decreased. Several yellow and red alerts were declared by the system operator in Luzon and Visayas during the summer period of April to May 2016. However, the Energy Sector’s El Niño Mitigation Measures alongside with the preparation for the 09 May 2016 National and Local Elections stabilized the power situation during the critical periods. These measures include the activation of the Interruptible Load Program (ILP), ensuring minimal forced outages, management of power plant maintenance schedules and optimization of hydro capacities specifically in Mindanao. Note: Due to rounding totals may not correspond to the sum of all figures Definition of Terms Installed Capacity
Dependable Capacity
Available Capacity
Gross Generation - total generation of electricity by an electrical power plant Peak Demand - maximum electrical demand occurring at any given period of time Electricity Sales - actual energy sold by Distribution Utilities (DUs) to the residential, commercial, industrial and others sectors Electricity Consumption - electricity sales plus the own-use consumption of power plant and systems loss Committed Power Projects - private sector initiated power projects which have already secured financial closing Indicative Power Projects - private sector initiated projects which have already applied for DOE Endorsement for the conduct of the System Impact Study (SIS) and yet to secure financial closing Interruptible Load Program – a demand-side management program which allows big end-users to disconnect from the grid, use their own generators, and get an ERC-approved compensation January - June 2016 Philippine Power Demand
Click link to view/download PDF File of 2016 Power Situation Highlights |
||||||||||||||||||||||||||||||||||||||||||||||||||||||||||||||||||||||||||||||||||||||||||||||||||||||||||||||||||||||||||||||||||
2015 Philippine Power SituationTuesday, 20 September 2016January-December 2015 Summary
SIGNIFICANT INCIDENTS
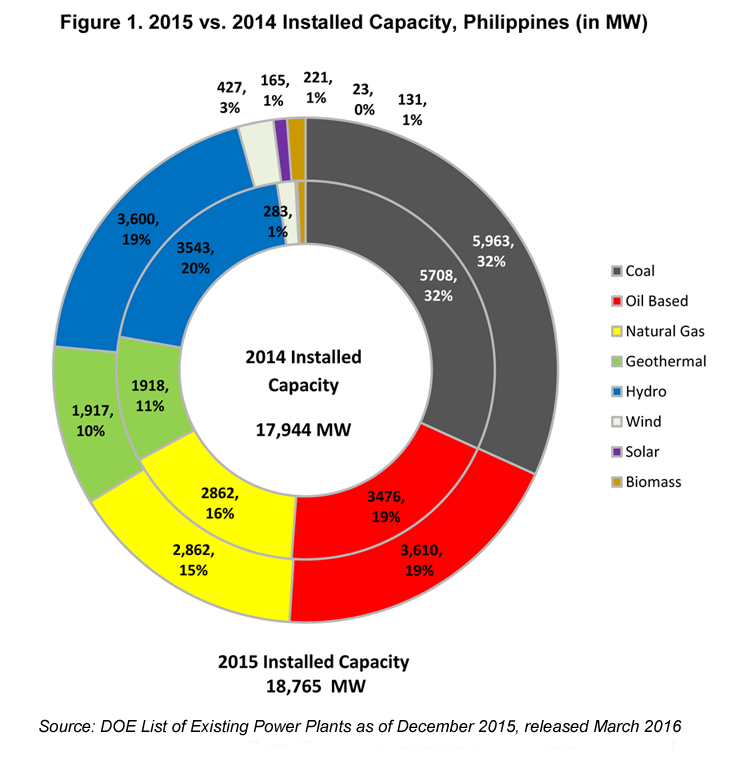
A. INSTALLED, DEPENDABLE AND AVAILABLE CAPACITY The Philippines’ total installed generating capacity continued to grow by 4.6% from 17,944 MW in 2014 to 18,765 MW in 2015 equivalent to 821 MW increase. Coal-fired power plants constitute the largest share in the installed and dependable capacity in 2015 at 32% and 34% respectively. Among renewable energy, hydro sources’ share remained the highest at 19% majority of which comes from the Mindanao Grid. With the FIT incentives and continued support of the DOE and energy agencies and stakeholders, Variable Renewable Energy (VRE) such as wind and solar grew remarkably by 50.9% (144 MW increase) and 616.0% (142 MW increase) respectively from 2014 to 2015 as shown in Figure 1.
The percent share on a per Grid basis remained unchanged over the years. In 2015, almost 75% of the total capacities was in Luzon, while Visayas and Mindanao, with at par shares, comprised the remaining 25%. The commercial operation of power plants from different technologies provided the needed additional capacities for the Luzon Grid in 2015. On the average, the actual available capacity during peak hours in Luzon, Visayas in Mindanao was 70% of the total installed capacity in the Philippines in 2015. Among other plant technologies, natural gas in Luzon provided the highest percentage of available capacity over installed capacity at 95%, followed by coal at 85% and geothermal at 70%. Whereas, wind and solar, due to variability and intermittency, provided the lowest available capacity in 2015 at only 22% and 33% of the total installed capacity. For Visayas and Mindanao, coal-fired power plants delivered the highest available capacity at 91% and 89% respectively. The actual available capacity over installed capacity provided by wind and solar was the highest in Visayas at 89% and 72%. However, due to El Niño, the available capacity of hydro in Mindanao was limited to only 58% of the total hydro capacity. Table 1. 2015 vs. 2014 Installed, Dependable and Available Capacity, Philippines (in MW)
Click link to view/download PDF file of the 2015 Philippine Power Situation |
||||||||||||||||||||||||||||||||||||||||||||||||||||||||||||||||||||||||||||||||||||||||||||||||||||||||||||||||||||||||||||||||||
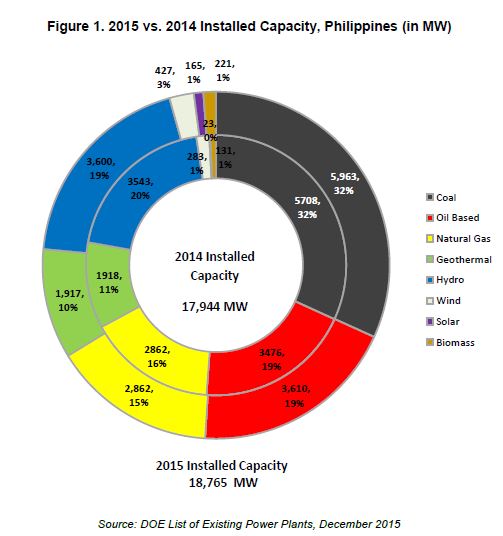
Power Situation Report 2015Wednesday, 10 August 2016A. INSTALLED, DEPENDABLE AND AVAILABLE CAPACITY The Philippines' total installed generating capacity continued to grow by 4.6% from 17,944 MW in 2014 to 18,765 MW in 2015 equivalent to 821 MW increase. Coalfired power plants constitute the largest share in the installed and dependable capacity in 2015 at 32% and 34% respectively. Among renewable energy, hydro sources' share remained the highest at 19% majority of which comes from the Mindanao Grid. With the FIT incentives and continued support of the DOE and energy agencies and stakeholders, Variable Renewable Energy (VRE) such as wind and solar grew remarkably by 50.9% (144 MW increase) and 616.0% (142 MW increase) respectively from 2014 to 2015 as shown in Figure 1.
The percent share on a per Grid basis remained unchanged over the years. In 2015, almost 75% of the total capacities was in Luzon, while Visayas and Mindanao, with at par shares, comprised the remaining 25%. The commercial operation of power plants from different technologies provided the needed additional capacities for the Luzon Grid in 2015. On the average, the actual available capacity during peak hours in Luzon, Visayas in Mindanao was 70% of the total installed capacity in the Philippines in 2015. Among other plant technologies, natural gas in Luzon provided the highest percentage of available capacity over installed capacity at 95%, followed by coal at 85% and geothermal at 70%. Whereas, wind and solar, due to variability and intermittency, provided the lowest available capacity in 2015 at only 22% and 33% of the total installed capacity. For Visayas and Mindanao, coal-fired power plants delivered the highest available capacity at 91% and 89% respectively. The actual available capacity over installed capacity provided by wind and solar was the highest in Visayas at 89% and 72%. However, due to El Niño, the available capacity of hydro in Mindanao was limited to only 58% of the total hydro capacity.  As shown in Table 2, new power plants were commissioned in 2015 from different technologies such as the 135 MW South Luzon Thermal Energy Corporation (SLTEC) Coal-Fired Power Plant Unit 1 in Batangas, 13.2 MW Sabangan Hydroelectric Power Plant (HEPP) in Mt. Province and 6 MW Sinoma Waste Heat Recovery System in Rizal. In addition, the 100 MW Gas Turbine Power Plant in Navotas was rehabilitated by Millennium Energy Inc. (MEI) and is currently embedded under the MERALCO franchise area. On the second half of 2015, more RE-based plants from wind, biomass and solar went online totaling to 265 MW such as the 54 MW Alternergy Wind Farm in Pililia, Rizal, 20 MW Isabela Biomass Energy Corporation (IBEC) Bagasse-Fired Power Plant, and 13 MW Bataan 2020 Rice Husk-Fired Power Plant. There were also solar photovoltaic (PV) farms which have been operational such as the 10 MW Phase 1 and 13.1 MW Phase 2 of Raslag Corporation Solar Farm in Pampanga, 41.3 MW Majestic Solar Rooftop in Cavite, 4 MW Burgos Solar Farm in Ilocos Norte, and the 1.5 MW rooftop-installed solar panels of Solar Philippines which is located at SM North EDSA.  On the other hand, Visayas’ net increase in capacity was the smallest compared to the two Grids. Based on Table 3, newly operational RE plants coming from biomass, wind, and solar provided additional 200 MW in the installed capacity and 170 MW in the dependable capacity. However, due to the decommissioning of Salcon’s Cebu Thermal Power Plant (TPP), the total installed and dependable capacity of coal declined in 2015. The units of Cebu Land-Based Gas Turbine of SPC Island Power Corporation is currently under preservation and have not provided power to the grid during the past years which contributed to the 80 MW drop in dependable capacity coming from oil-based sources in 2015. On the same manner, the non-operation of DESCO Inc.’s Natural Gas Power Plant due to non-availability of fuel and the adjustments in capacities of Unified Leyte Geothermal Power Plants also decreased the dependable capacity of the Visayas Grid.
 As shown in Table 4, in 2015, the capacities in Mindanao inched up significantly compared to previous years after the entry of new power plants coming from base-load coal (150 MW Therma South Coal Unit 1), oil (20.9 MW Peak Power Soccsargen, 5.9 MW Peak Power ASELCO, and 7.8 MW King Energy - Maramag) and solar (12.5 MW Kirahon Solar Farm and 6.2 MW Centralla Solar Farm). On the other hand, the dependable capacity of hydro declined by 3 MW due to deratings.  |
||||||||||||||||||||||||||||||||||||||||||||||||||||||||||||||||||||||||||||||||||||||||||||||||||||||||||||||||||||||||||||||||||
Power Situation Report 2014Friday, 5 June 2015
A. INSTALLED AND DEPENDABLE CAPACITY Total installed and dependable capacity in the country as of 31 December 2014 slightly increased to 17,944 MW and 15,633 MW, respectively due to the entry of new power plants in the three grids adding 557 MW to the installed capacity and 153 MW in dependable capacity. Figure 1. Installed and Dependable Capacity
Source: List of Existing Power Plants as of December 2014 Installed capacity in Luzon totaled to 13,213 MW or 73.6% of the total installed capacity mix followed by Visayas with 2,520 MW or 14%. Mindanao has 2,211 MW or 12.3%. As of the breakdown of dependable capacity, 11,622 MW or 74.3% is accredited to Luzon grid, 2,160 MW or 13.8% is from Visayas, and 1,851 MW or 11.84% is from Mindanao. In Luzon, new plants were commercially operational such as 18.9 MW Northwind Phase 3, 81 MW UPC Caparispisan wind, 150 MW EDC Burgos wind farm which are all in the Ilocos region and the 12 MW SCJI power Biomass plant in Nueva Ecija. In addition, the inclusion of the 140 MW Petron Refinery Solid Fuel‐Fired Boiler (RSFFB) power plant in Limay, Bataan, 12.7 MW Lafarge diesel power plant and the 1.8 MW Communal‐Uddiawan mini‐hydro plant in Nueva Ecija resulted to an increase in installed capacity by 421 MW. Moreover, the adjustments made in the dependable capacity of plants such as GN Power in Mariveles, Bataan, TMO Barges in Navotas, Bacman Geothermal Power Plant in Sorsogon due to improved dependable capacity as well the uprating of Binga Hydroelectric power plant in Benguet from 125 MW to 132 MW, unavailability of Botocan hydroelectric power plant in Laguna due to transmission line problem and the decline in dependable capacity of Montalban Methane Facility in Rizal and Bacavalley LFG in Laguna resulted to a 103 MW net increase in dependable capacity for Luzon. Table 1. Comparison of Installed and Dependable Capacity, Luzon
Source: DOE List of Existing Power Plants as of December 2014 The installed and dependable capacity in Visayas as indicated in Table 2, increased by 59 MW and 47 MW, respectively due to the commercial operation of the additional 9 MW SACASOL solar farm in San Carlos City and the 50 MW Nasulo Geothermal Power plant, both located in Negros Occidental. Table 2. Comparison of Installed and Dependable Capacity, Visayas
Source: List of Existing Power Plants as of December 2014 In Mindanao, 124 MW and 102 MW were added to the installed and dependable capacity of oil‐based and hydroelectric power plants. The grid additional capacity of 15 MW came from Mapalad Power Corporation (MPC)‐Digos, 19 MW SoEnergy, 15 MW Mapalad Energy Generation Corporation (MEGC) Diesel plant, 15 MW Panaon Diesel plant and 8 MW Tandag Diesel plant of King Energy Generation Inc. (KEGI) for Oil‐based plants, while additional 13.6 MW was added from Tudaya 1 and 2 Hydroelectric power plants in Davao del Sur. The 37.1 MW thermal plant from the directly‐connected industry Philippine Sinter Corporation (PSC) also augmented the existing plants in Mindanao that supplies power to the grid. Table 3. Comparison of Installed and Dependable Capacity, Mindanao
Source: DOE List of Existing Power Plants as of December 2014 |
||||||||||||||||||||||||||||||||||||||||||||||||||||||||||||||||||||||||||||||||||||||||||||||||||||||||||||||||||||||||||||||||||


